


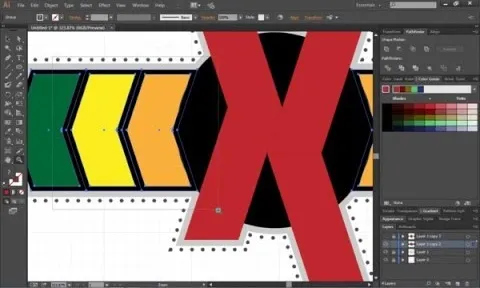
You will learn to create graphs in Illustrator. The best way to visualize data is a graph, and there are several different graph choices in this program. He chooses a column graph to show how he creates his graphs. Holding the left mouse button and dragging, he creates a rectangle which will be our graph. This brings up an input screen beside the rectangle for the graph; he puts information into the screen which shows up on the graph when he is finished.
Apple's iOS 26 and iPadOS 26 updates are packed with new features, and you can try them before almost everyone else. First, check Gadget Hacks' list of supported iPhone and iPad models, then follow the step-by-step guide to install the iOS/iPadOS 26 beta — no paid developer account required.


Comments
Be the first, drop a comment!